{{active_subscriber_count}} active subscribers.

16 years of unconditional love 💌.
S2N Spotlight.
I have discussed the 60/40 (stocks/bond) portfolio often, and yes, I plan to move onto something a little more comprehensive and more palatable to most investors. The reason I persist is because it is such a simple but solid foundation from which to explain complex concepts without a lot of noise in the background.
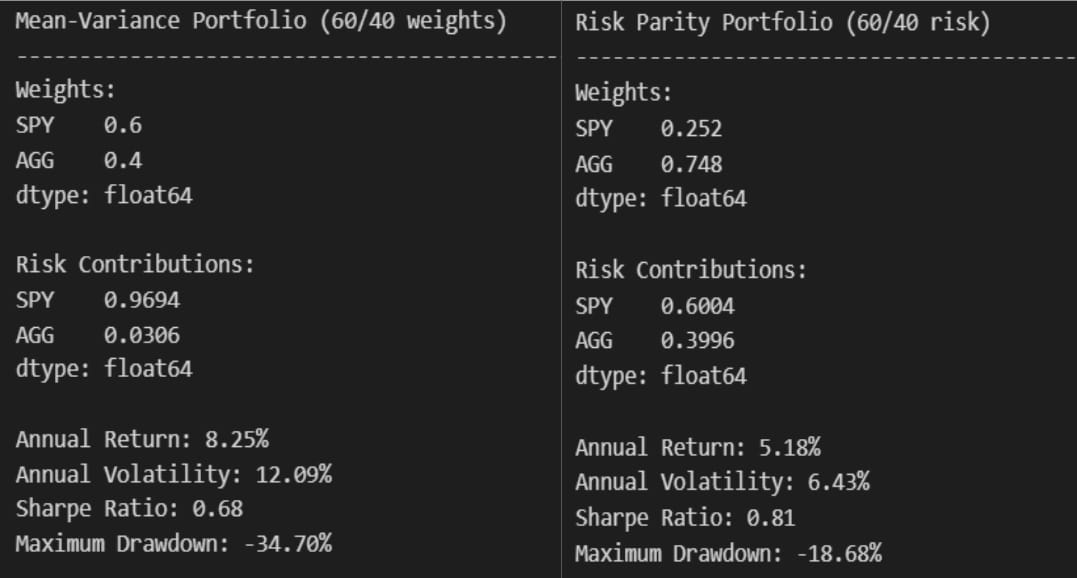
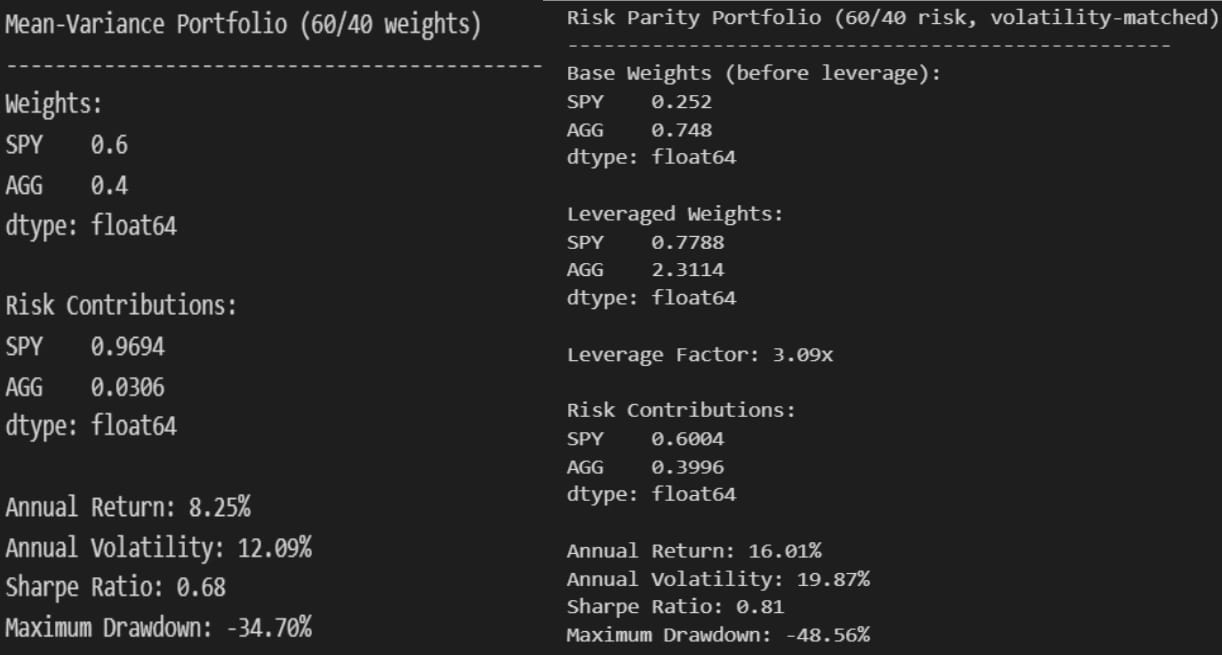
We start with a comparison of a static 60/40 portfolio and a risk parity portfolio. I am too lazy to change the labelling, but it is a mistake to call the static 60/40 portfolio a mean-variance portfolio. In the charts below you see the mean-variance (60/40) outperform, with more risk, the risk parity returns. The definition of risk parity in this context is that the weight of the stocks and bonds is based on keeping the risk 60% stocks and 40% bonds. This all becomes clearer with the tables below.
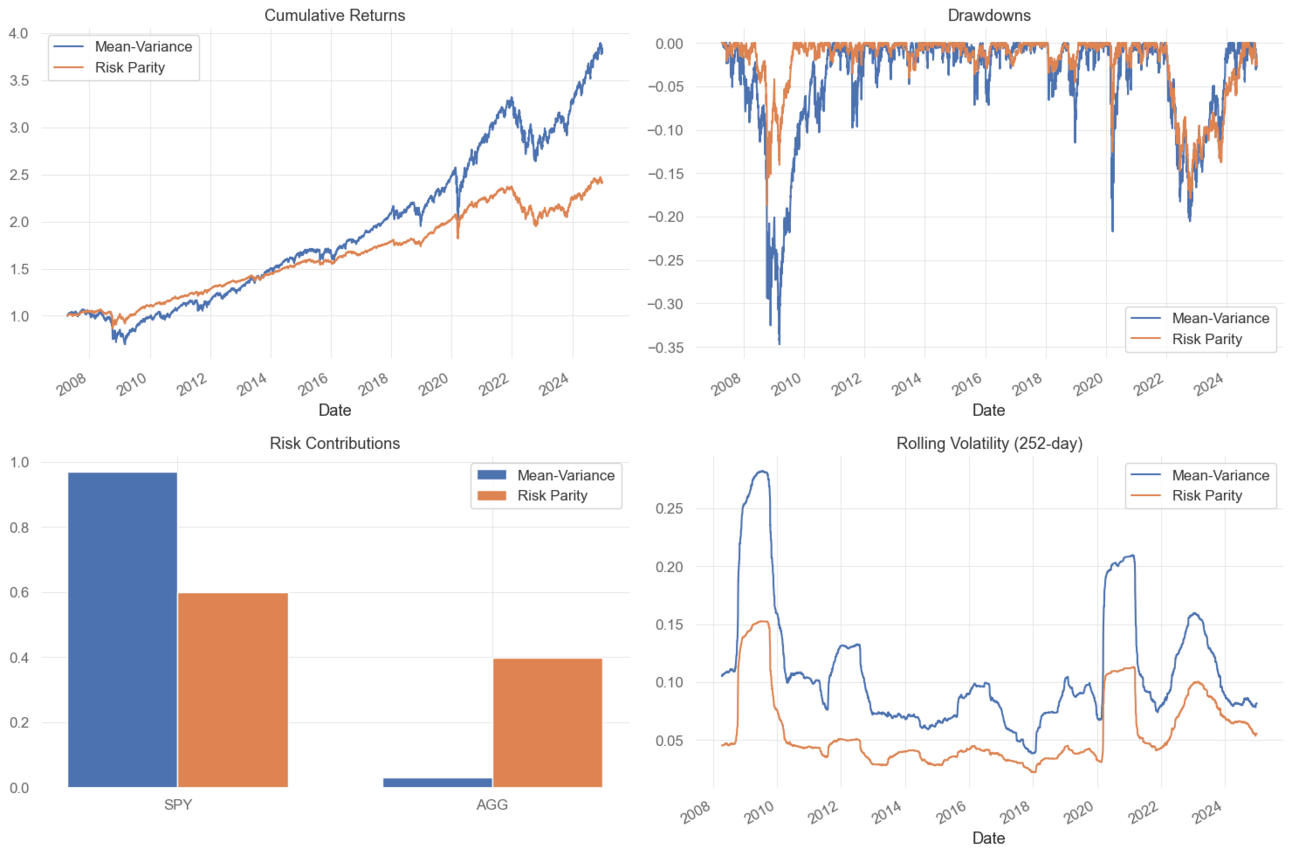
Based on the above charts, it is always more tempting to choose the blue line (mean-variance/60:40) over the risk parity. You have heard me say a million times that focusing on the Sharpe Ratio (risk-adjusted returns) is better for more reliable success over time. You can see very clearly that the higher weighting of stocks (SPY) at 60% contributes 96% of the risk. So I am going to take things one step further.
People who have worked with risk parity or other risk-based strategies know that because of the superior risk-adjusted returns, you can apply more leverage. There is a lot of fancy academic research to suggest that the Sharpe Ratio is indifferent to leverage, and they are largely correct but not entirely. The premise comes from the fact that all leverage does is multiply the return and the risk by the same amount, and hence the Sharpe Ratio stays the same, but they ignore the maxDD and its effect that is psychologically more damaging than rational math takes into account.
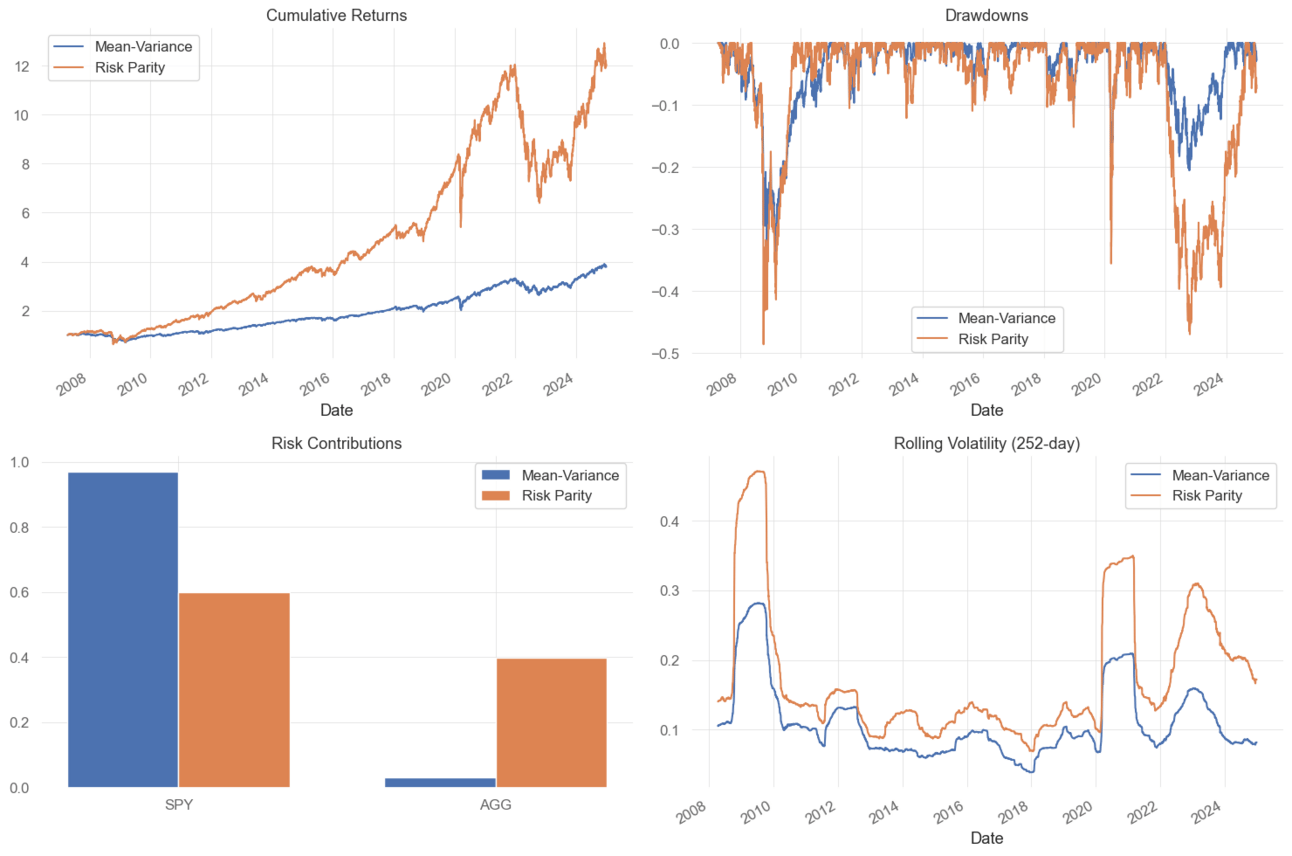
As you can see from the above and below, the Sharpe Ratio is the same as it was, but the Risk Parity Total Returns smashes the static 60/40 portfolio. The leverage was volatility matched against the SPY risk. One can play around with the volatility target.
In summary, I would without question go with a risk parity approach with a slightly lower volatility target. Who would have thought that so much clever stuff can be done with a 2-symbol portfolio?
S2N Observations
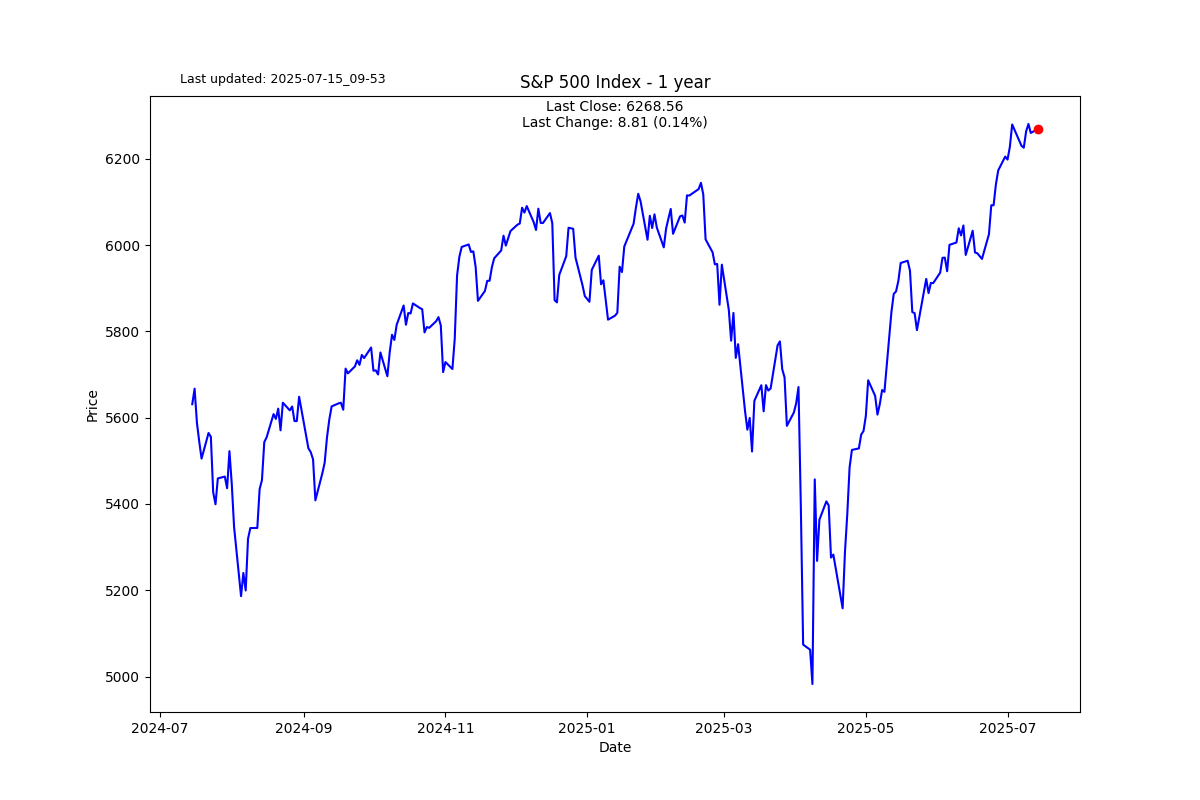
I have been thinking over the last few weeks about how all-time highs for indexes like the S&P 500 are going to play havoc on active asset allocations and strategy selection over the next decade or so. I am penning it here with no explanation, as it is a big subject that needs to be researched properly.
The simple story is like this. When you compare a mean reversion strategy or a trend strategy on stocks, you are likely to benchmark it against a buy and hold of the S&P 500. If you are simply looking at total return, given the fact that we are at all-time highs, you will forever believe buy and hold is the only option.
S2N Screener Alert
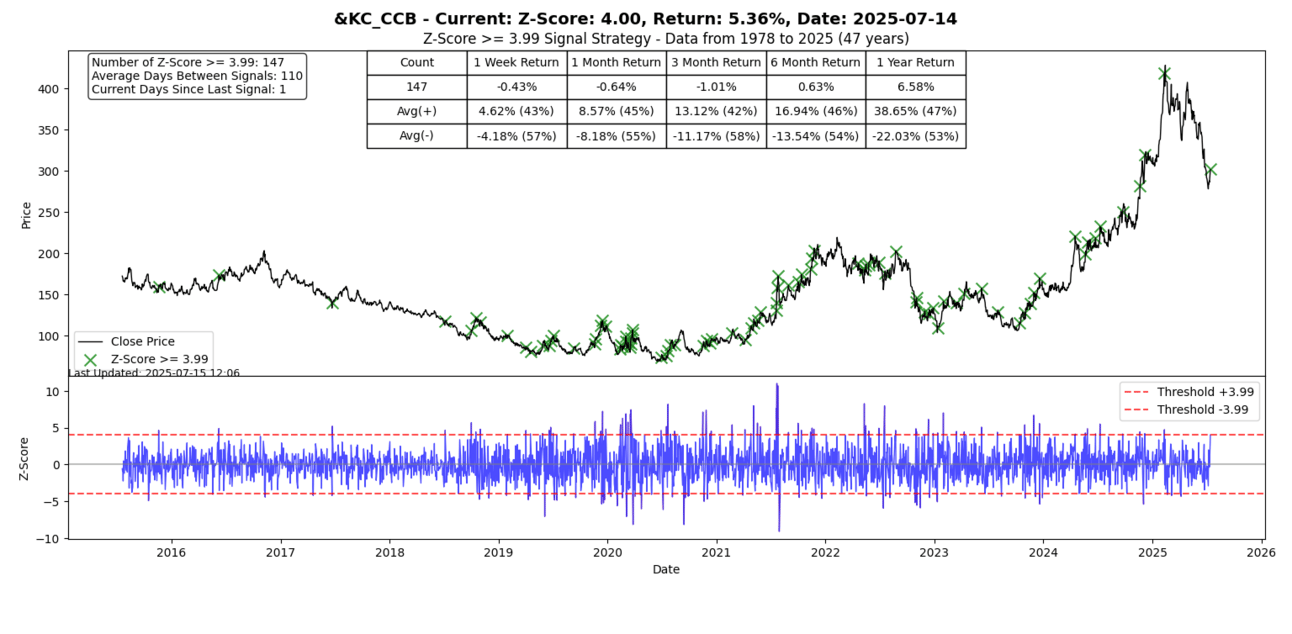
Coffee futures rallied with a +4 daily Z-score; this may reverse the recent weakness. I am sure tariffs are playing a role.
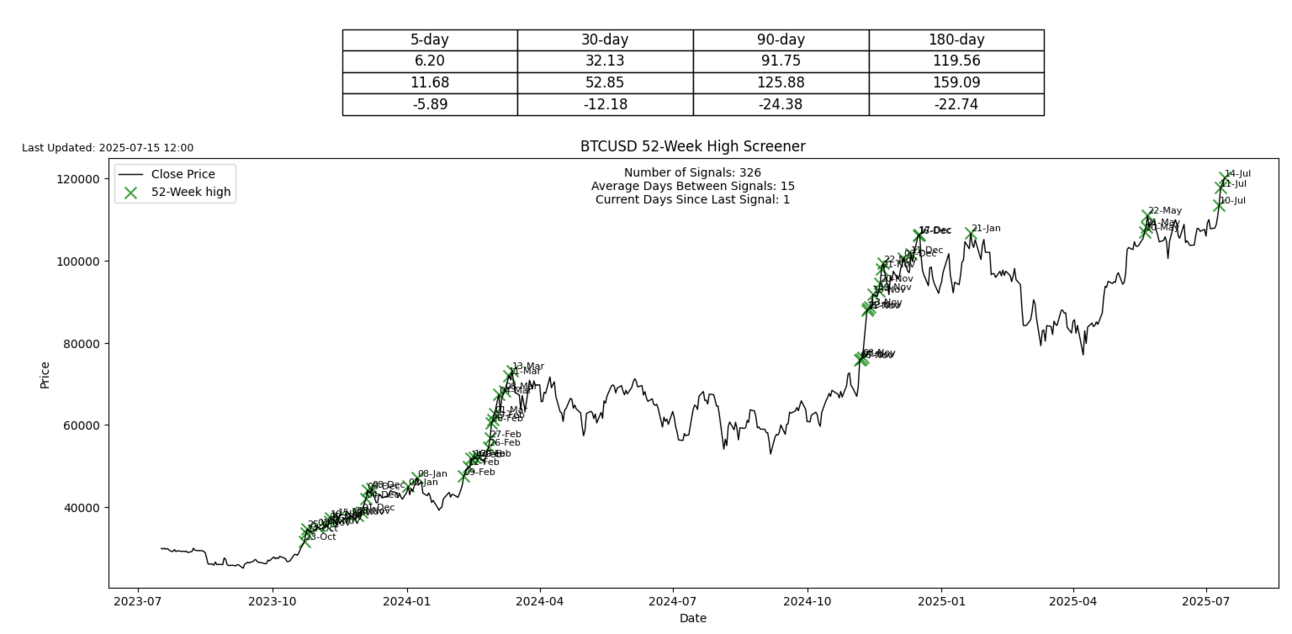
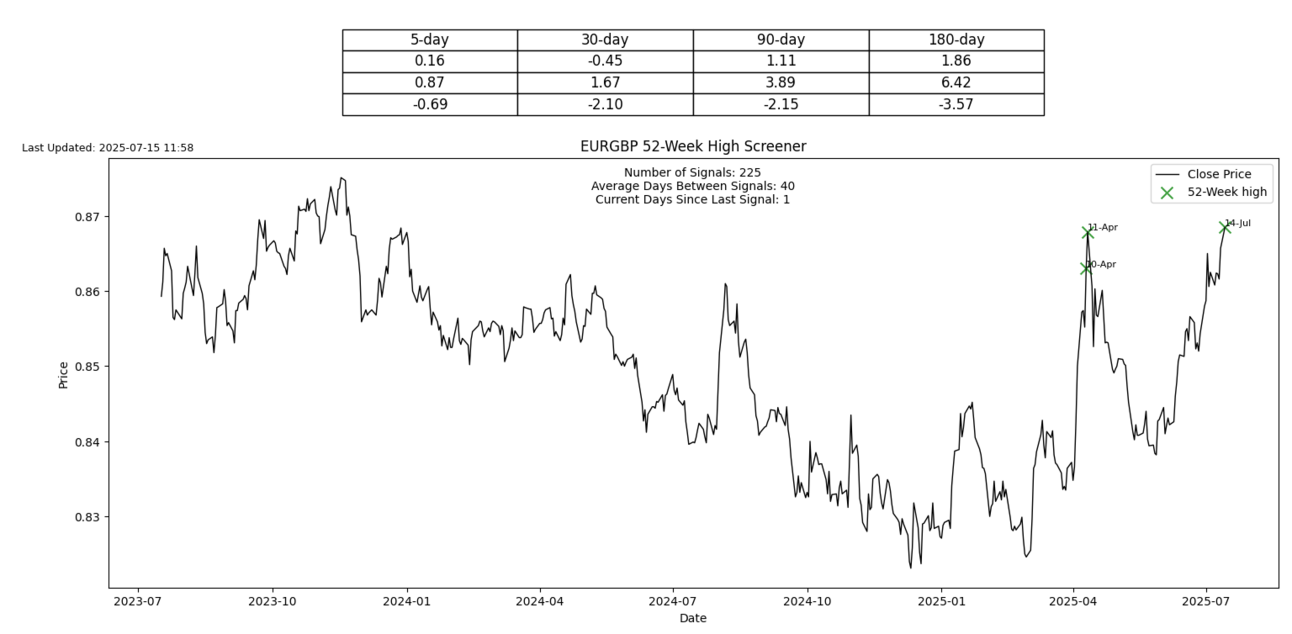
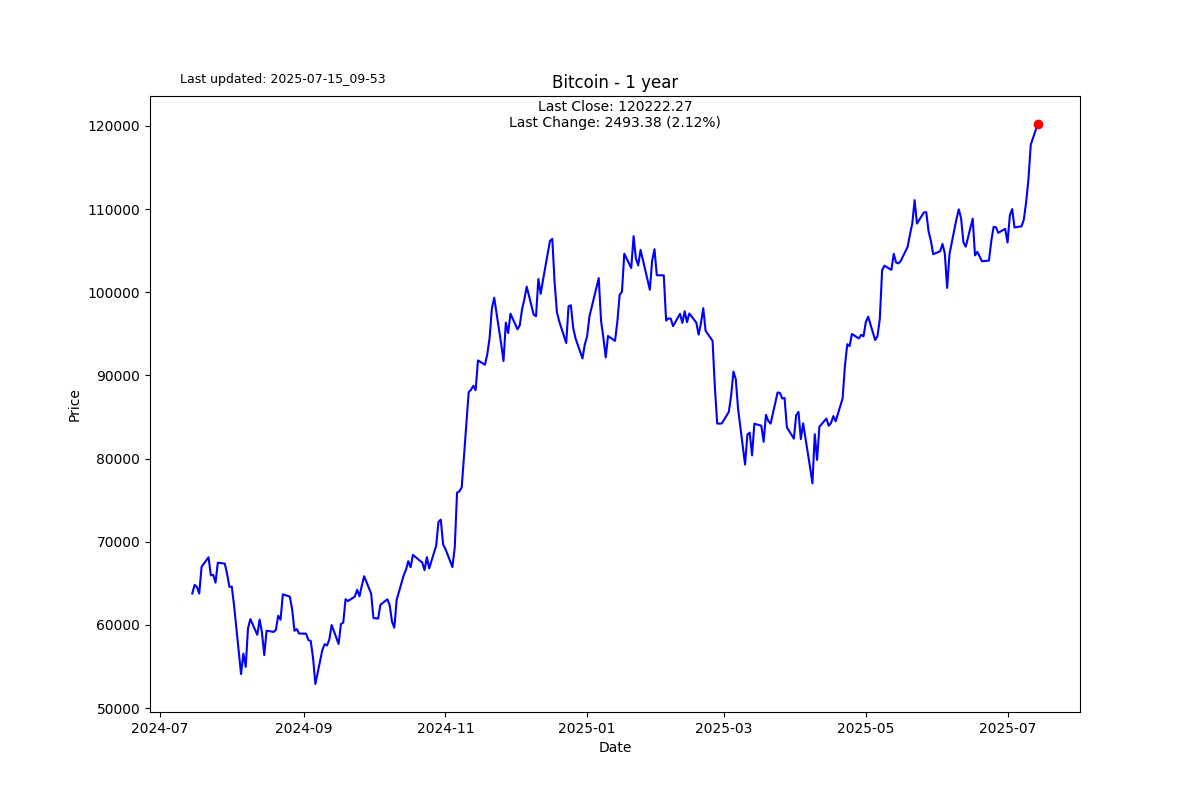
I am sharing 2 symbols that triggered 52-week highs. Bitcoin also is triggering an ATH.
If someone forwarded you this email, you can subscribe for free.
Please forward it to friends if you think they will enjoy it. Thank you.
S2N Performance Review

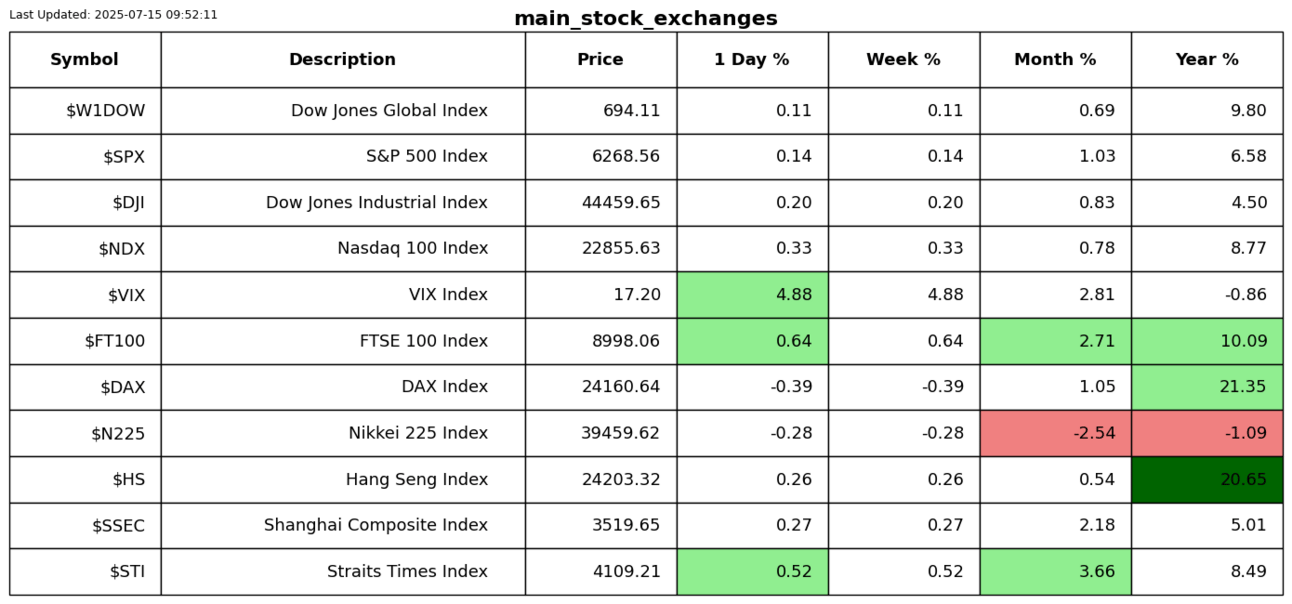
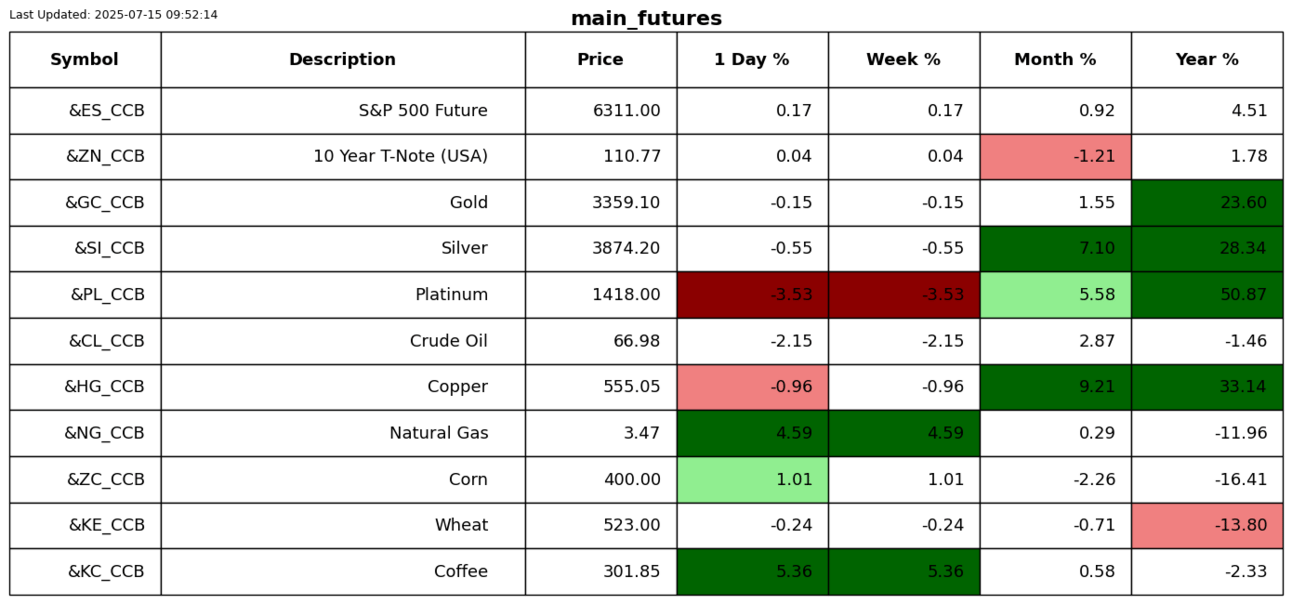
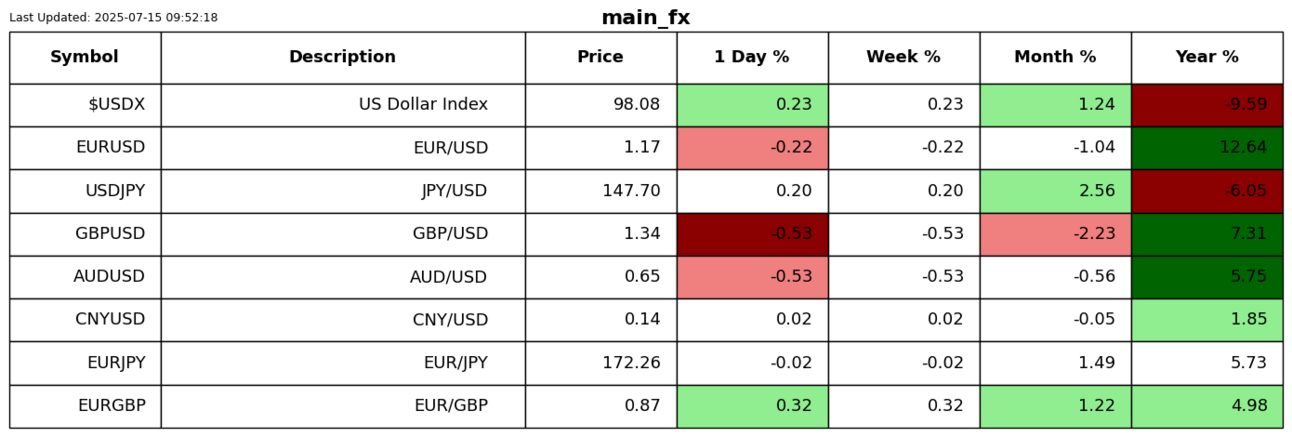


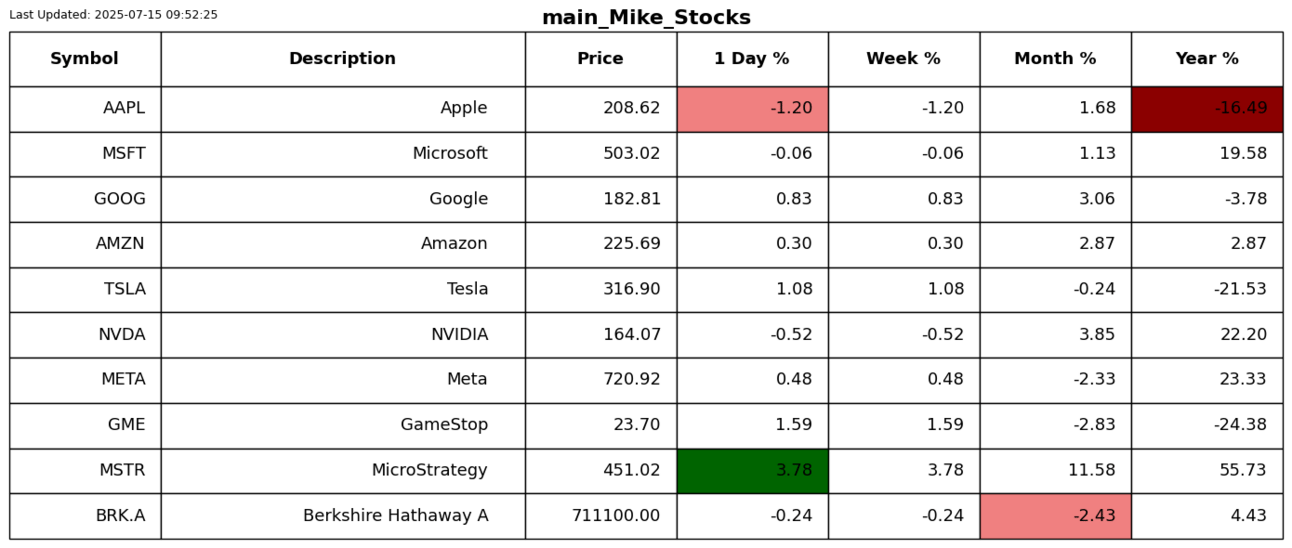
S2N Chart Gallery
S2N News Today
