{{active_subscriber_count}} active subscribers.
S2N Spotlight
Not the 60/40 stock/bond portfolio again.
As I build my Python-based quantitative framework, consolidating all the work I have done over the last two years in a neat, scalable, visually easy-to-digest way, I keep gaining more insights. I will share more tactical asset allocation models in the future, but I find it much easier to get a deeper understanding when you only have 2 assets in the optimization engine. A 3rd asset takes you from linear to quadratic complexity, which is too hard for my pip to wrap around on a Monday morning.
From 1990-01-02 to 2025-08-08 (35 years), the 60/40 strategy that rebalances every month produced a 947% total return versus the S&P 500 Total Return benchmark of 3560%. The only thing going for the strategy is that it has a higher Sharpe Ratio of 0.78 versus 0.65, definitely not worth the sacrifice.

Here is a cleaner look at the outperformance of the benchmark on the upside and the outperformance of the strategy on the downside. But we need to go deeper still.

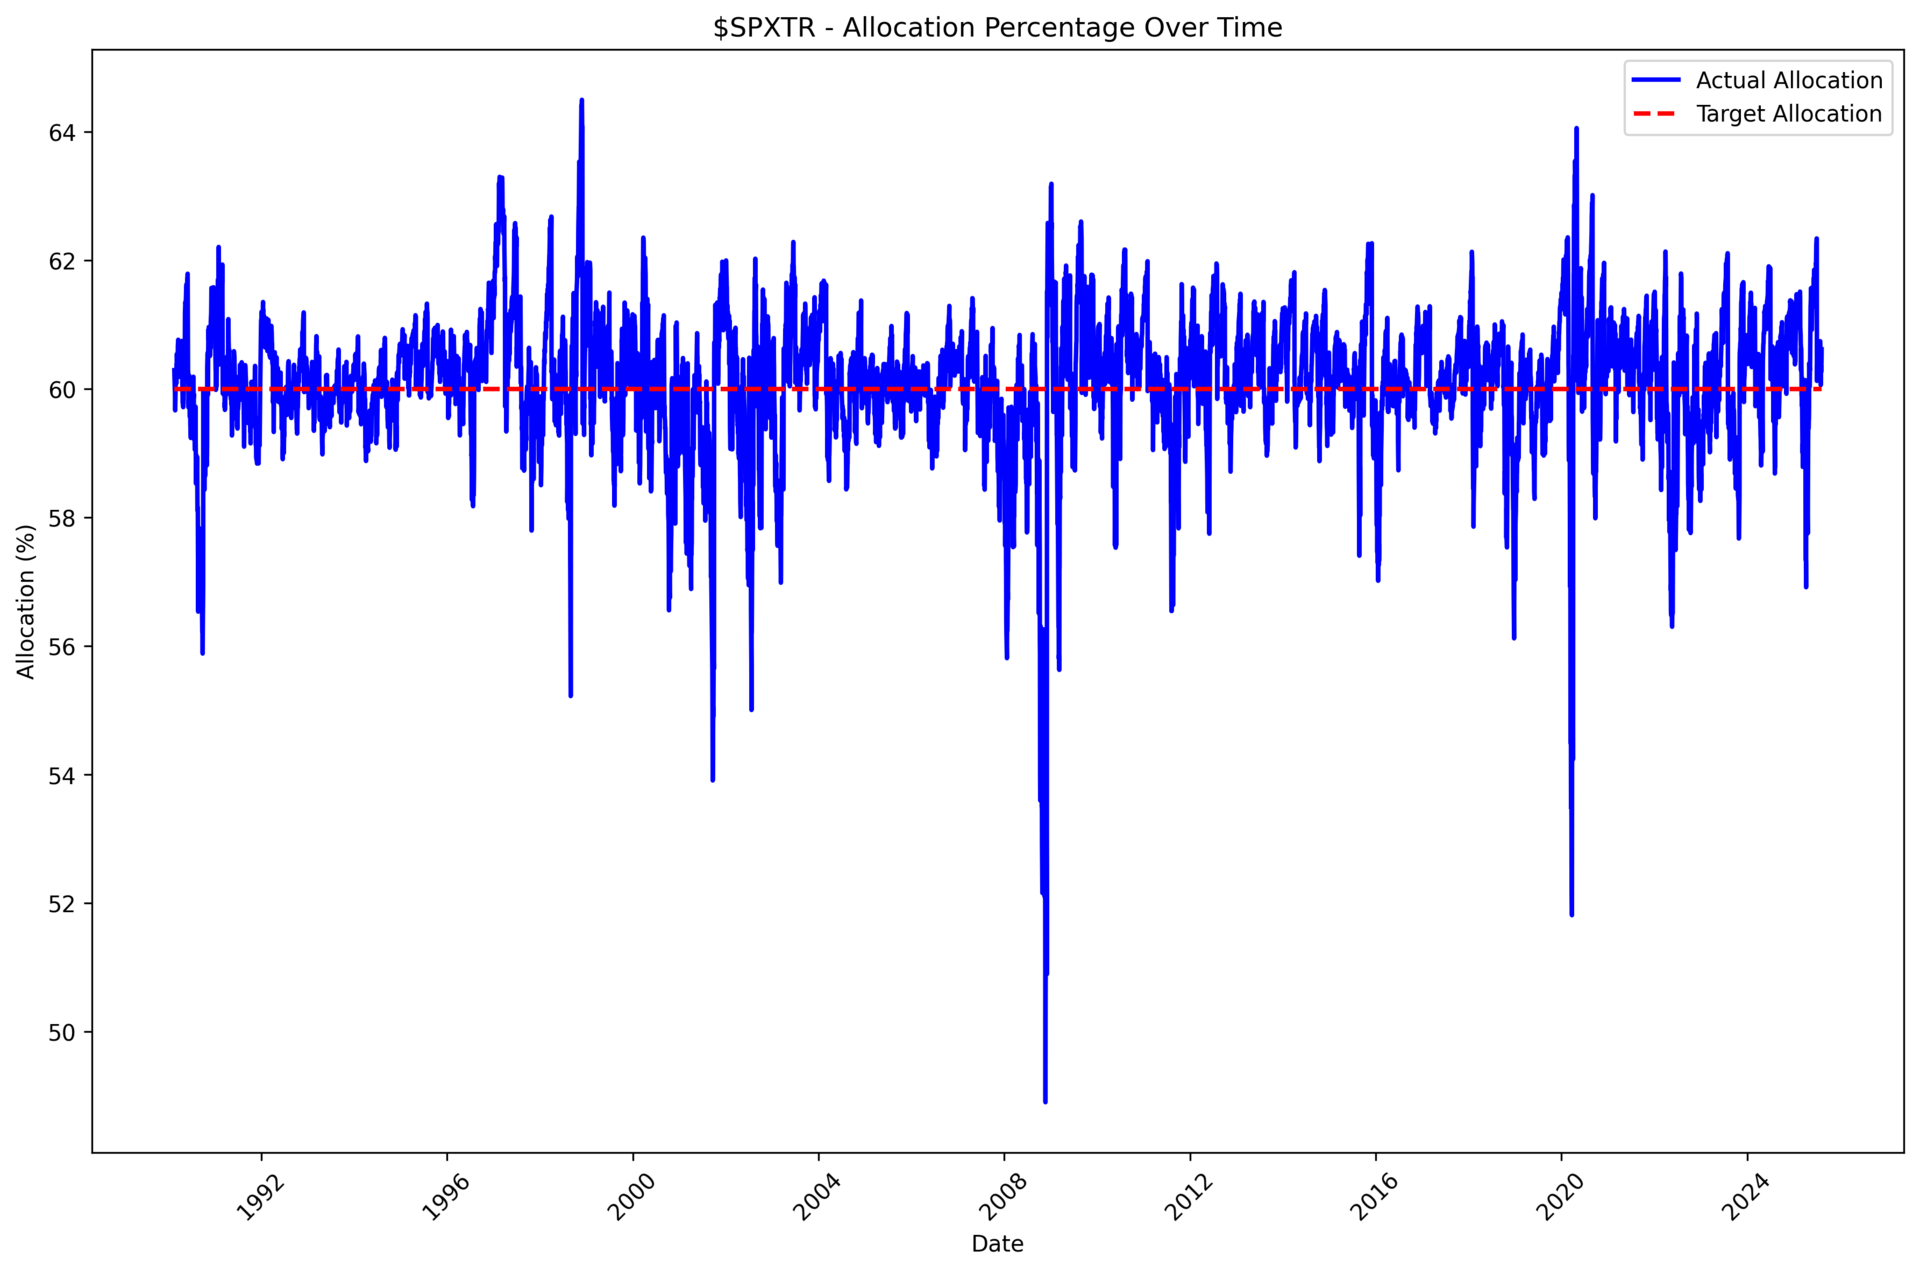
The next table starts to highlight how much of the portfolio is dominated by the S&P 500 return and how the allocation effect is negative on an individual and an aggregate level.

In this chart you can see the individual symbol contribution from each symbol. If it was a buy and hold on its own or as part of the portfolio. 95% of the return is coming from the S&P 500, which is clearly doing all the heavy lifting, and one therefore needs to ask the question if the bond returns are doing enough.

The next few charts show the individual symbol breakdowns in a little more detail.


In conclusion, you could run this strategy at 2x leverage because of the much lower volatility, which will significantly increase its returns and risk-adjusted returns. We will look at that separately as well as other techniques to juice the concept. I just cannot accept that a financial advisor recommending this strategy in its traditional form is adding much, if any, value to you.
S2N Observations
There are
World stock markets remain extremely expensive. Here are 2 different charts saying the same thing. This chart is produced by Owen Analytics an excellent resource for in-depth research.

Another angle.

50% of all Nvidia employees now have a net worth of at least $25 million. I need to fact-check that statistic, as there are 36000 employees; that would mean 18000 own $450 billion. I guess it’s possible. I am not sure if this is healthy or just envy on my part.
As much as I would love to get on board and say this is all sustainable, I think we remain on borrowed time. I am just not sure how long it can remain expensive before we feel the effects of all the drugs in the system. Mind the gap.
S2N Screener Alert
Growth vs Value just hit an all-time new high. Or, as my chart has it, value vs. growth hit an all-time new low.

If someone forwarded you this email, you can subscribe for free.
Please forward it to friends if you think they will enjoy it. Thank you.
S2N Performance Review


S2N Chart Gallery


