{{active_subscriber_count}} active subscribers.
S2N Spotlight
As we are constantly being told the bulk of the value of the S&P 500 market cap index, the one we are used to investing in, is dominated by a few technology heavyweight stocks. You can see by the green ratio button how the market cap index has accelerated relative to the equal weighted S&P 500 index.
If you are concerned that we may be in a bubble or even just overvalued territory, and you are not quite ready to commit to selling your equities or going short, then I would say the next best alternative is to switch from SPX (S&P 500 Market Cap) to SPXEW (S&P 500 Equal Weight).

S2N Observations
Really solid proof that the Shiller PE (or CAPE) i.e. 10 year trailing returns have a significant market timing effect on the next 10 years return in the markets.
From 1881-2025 you can see an r2 of 26% that is pretty significant. However, if you look at 1987-20215 with the violet colouring the r2 is 85% meaning that the PE ratio explains 86% of the future 10 years returns.
I have said it before and will say it again we are near record Shiller PE levels so the next 10 years are likely to be well below average. I know that is hard to accept given the strength of the current market, but there in lies the reason for the forecast.

S2N Screener Alert
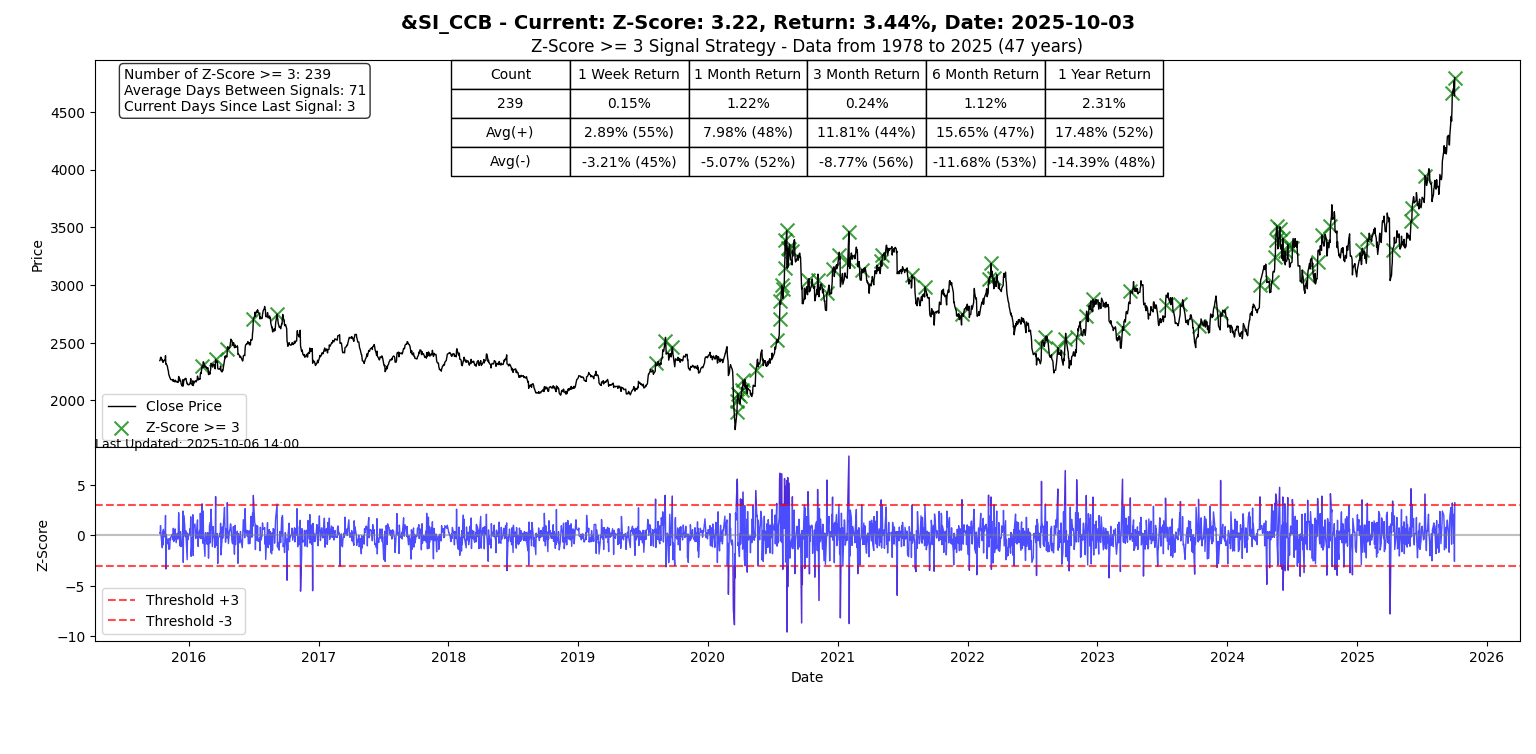
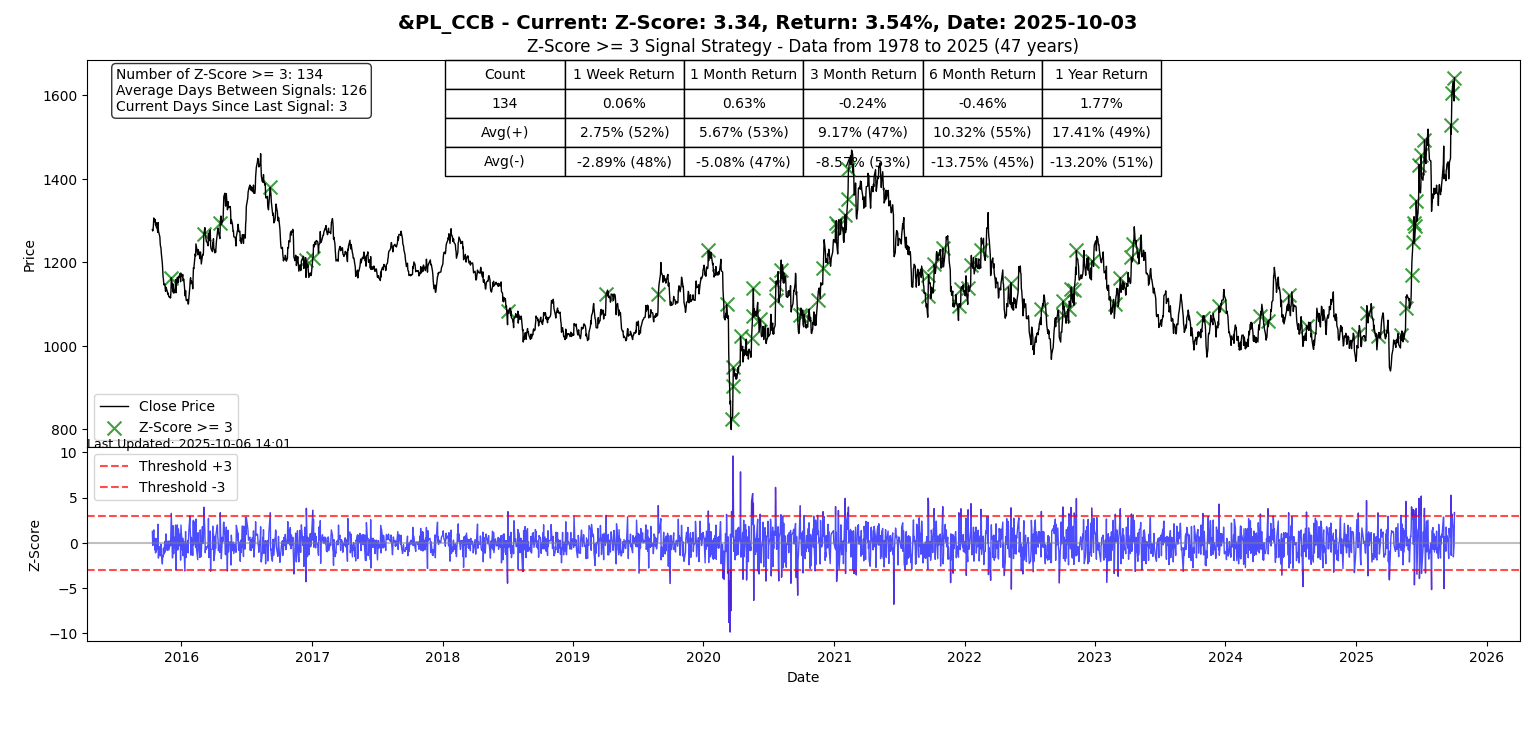
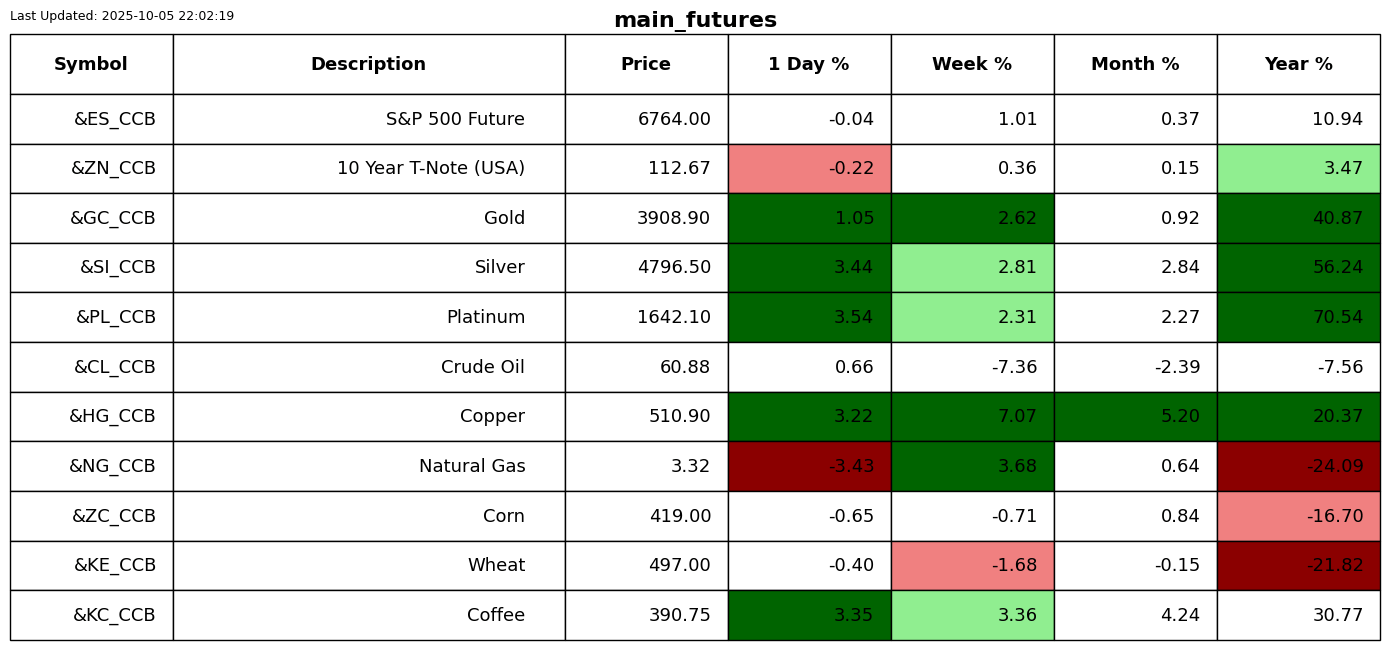
Silver and Platinum both had big 3 Z-Score up days.
If someone forwarded you this email, you can subscribe for free.
Please forward it to friends if you think they will enjoy it. Thank you.
S2N Performance Review



S2N Chart Gallery
S2N News Today

