{{active_subscriber_count}} active subscribers.
S2N Spotlight
Last week I wrote a little about the internal plumbing of the monetary system. On Friday something highly significant took place that is not being well covered in the mainstream financial media.
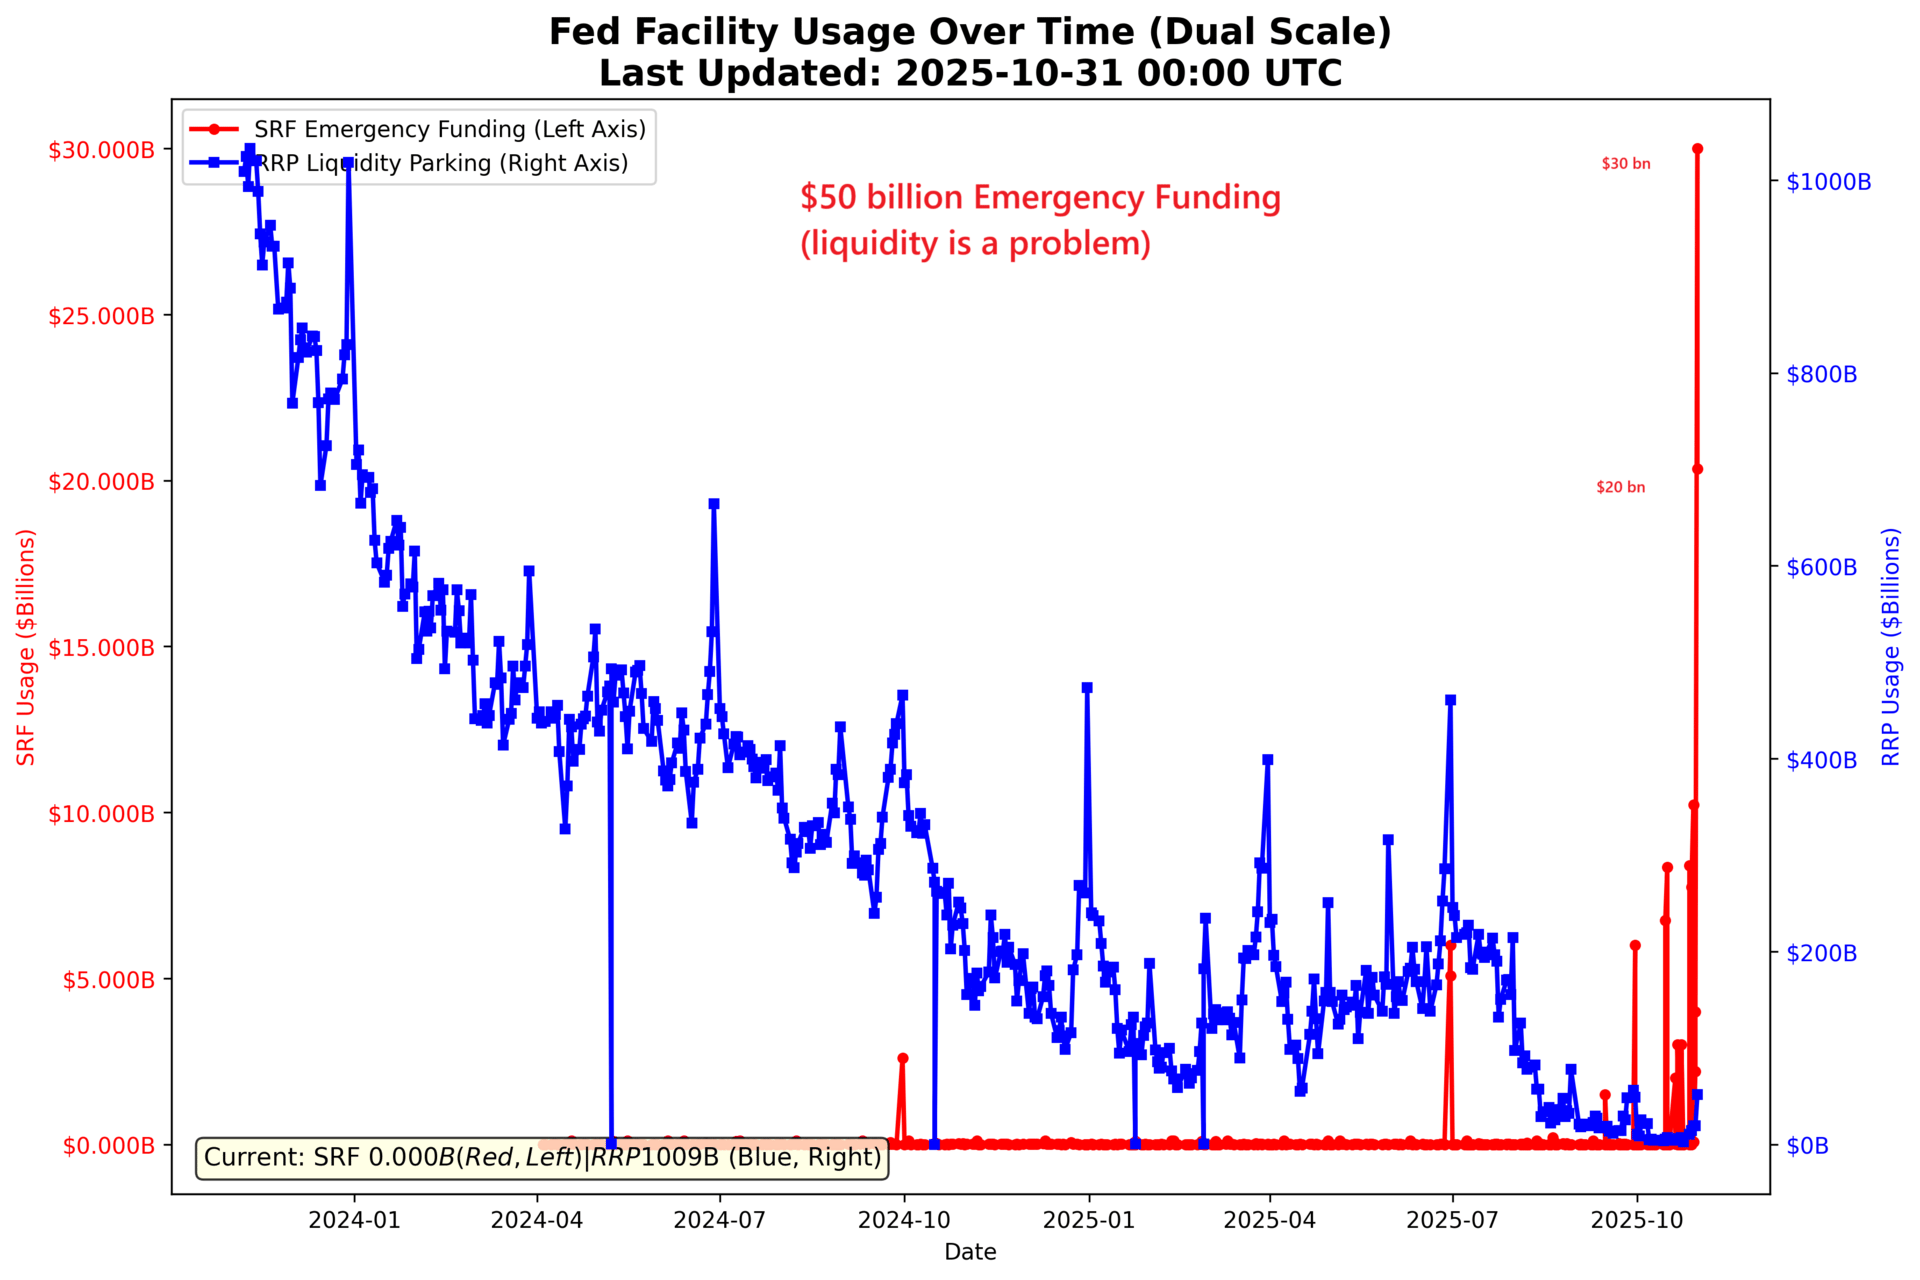
On Friday banks went begging to the Fed’s Standing Repo Facility for $50 billion of emergency funding. The morning auction saw a huge $20 billion borrowed, and later in the afternoon auction, a further $30 billion – ouch. Just for your information, anything in excess of $100 million, i.e., $0.1 billion, means things are tight.
One thing I have learned about crises is that they usually unfold after warning signs. I have stated before that liquidity concerns do not necessitate a crisis. But a monetary crisis usually unfolds once you see these kinds of cracks. These developments should take us up a Defcon level, so we should be further alert as to what is causing the liquidity crunch and its impact on the current bull stock and bond market.
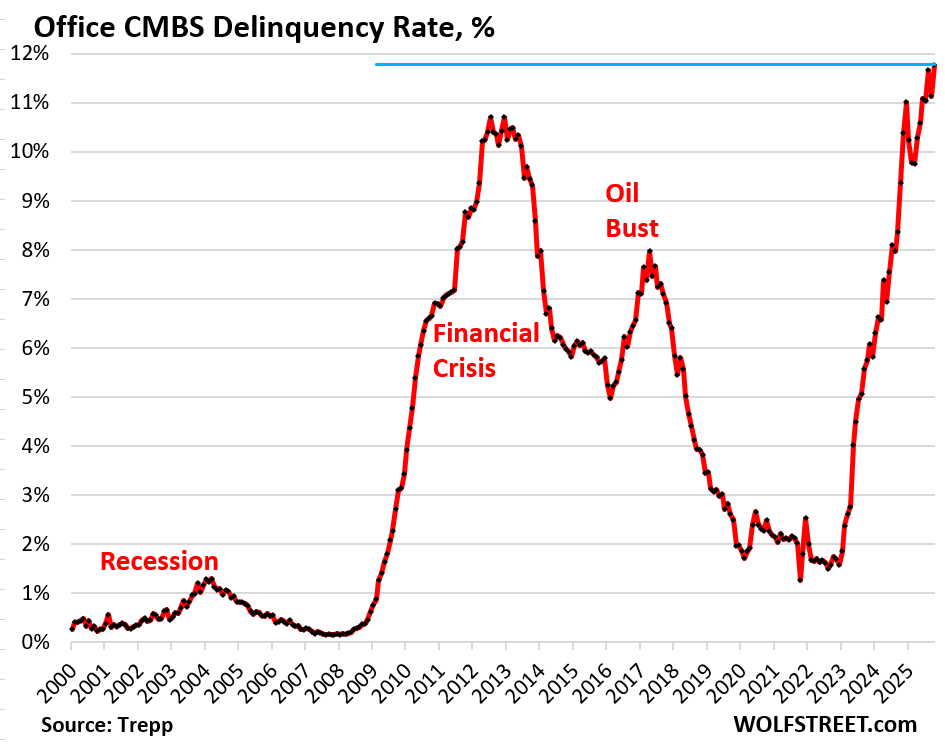
One thought is this chart showing the level of office commercial mortgage-backed securities with a delinquency rate above the level of previous financial crises might just be the signal. However, I suspect there are a number of non-profitable high-flying companies that must be struggling to service their commercial debt.
Just to stress, there go my puns again, the Standing Repo Facility is a backstop, not a normal liquidity source. It’s like a “fire extinguisher” — always available, but using it sends a signal that you have a problem getting funding elsewhere.
One of the most critical metrics to keep an eye on is the spread = SOFR − EFFR, as it shows how the secured market trades relative to the unsecured one. There is a lot to unpack in this statement. Many of you might be unfamiliar with these monetary facilities, so let us revisit them soon. For now let us simply acknowledge there could be something to be concerned about. And yes, the intention was to drive the rates down as you can see below.

S2N Observations
I am keen to see how the fixed income market plays out over the next few days. However, I need to re-emphasise a trade idea I had that enjoys even more conviction now. Especially following the warning signs in the monetary system.
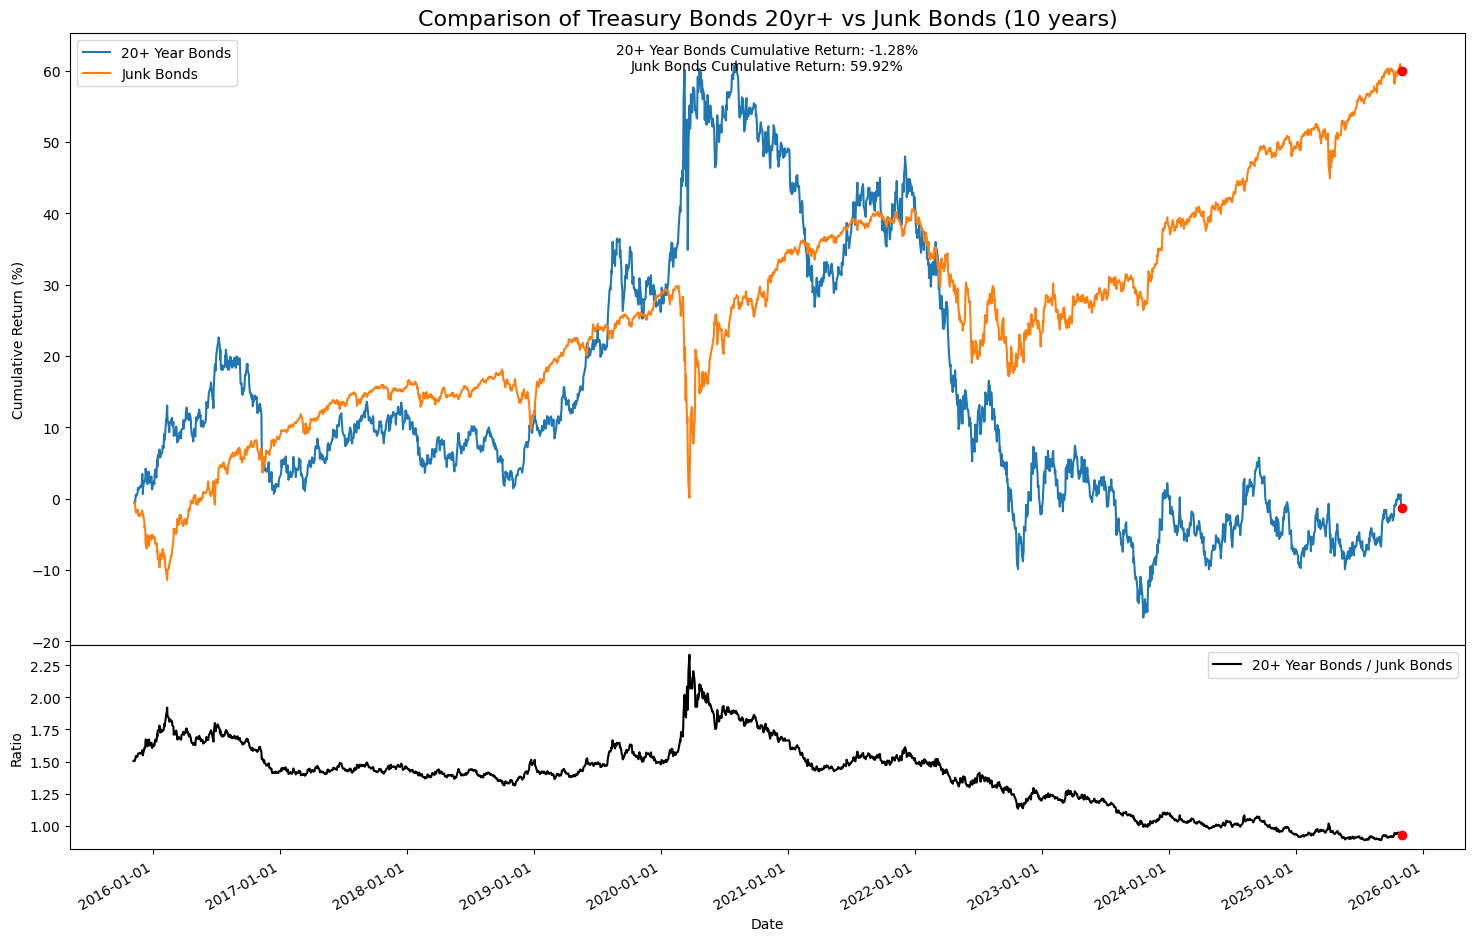
I believe junk bonds have been trading more like growth stocks than high-yield bonds. I therefore think the ratio in the chart below will soon start tracking up as junk sells off and long-term treasury bonds trade up on a relative basis. I have used ETFs JNK (Junk) and TLT (20yr+ Treasury bonds) to express the trade.
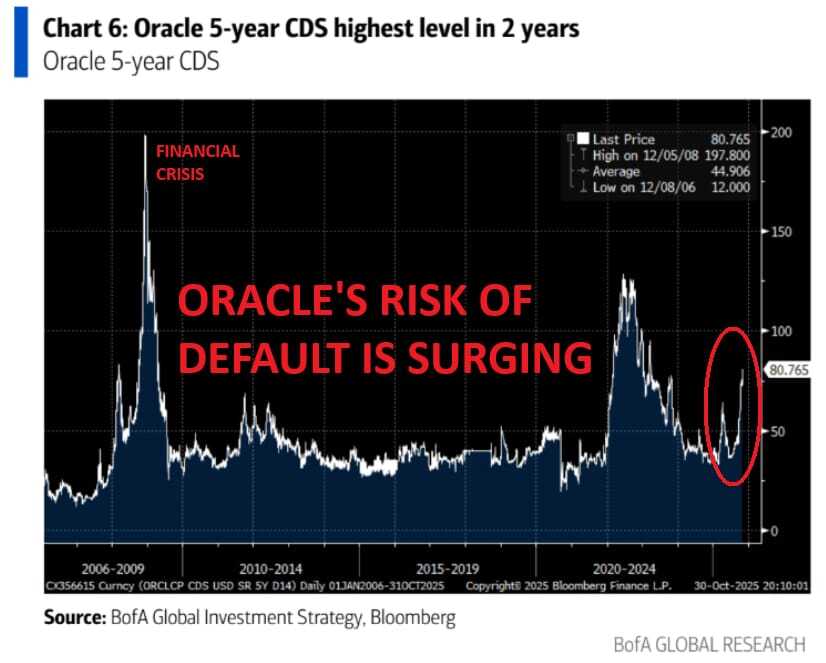
Something else came onto my radar over the weekend. Oracle recently shot to fame as part of the infinite money glitch, where everyone pledges to become each other’s customers and spend a shit tonne of money they don’t yet have, and the market seems to love it.

We should remember that after the drugs/alcohol wear off, there is a very real chance the beauty you thought you paired up with on your high isn’t quite what you thought “it” was. Reminds me of the saying, ‘Putting lipstick on a pig‘ doesn’t take away from the fact that it is still a pig. Oracle’s debt-to-equity ratio is currently off the charts at nosebleed levels.
Take note: the Oracle CDS chart is starting to rise again. Still not at crisis levels but certainly a trend to keep an eye on.

S2N Screener Alert
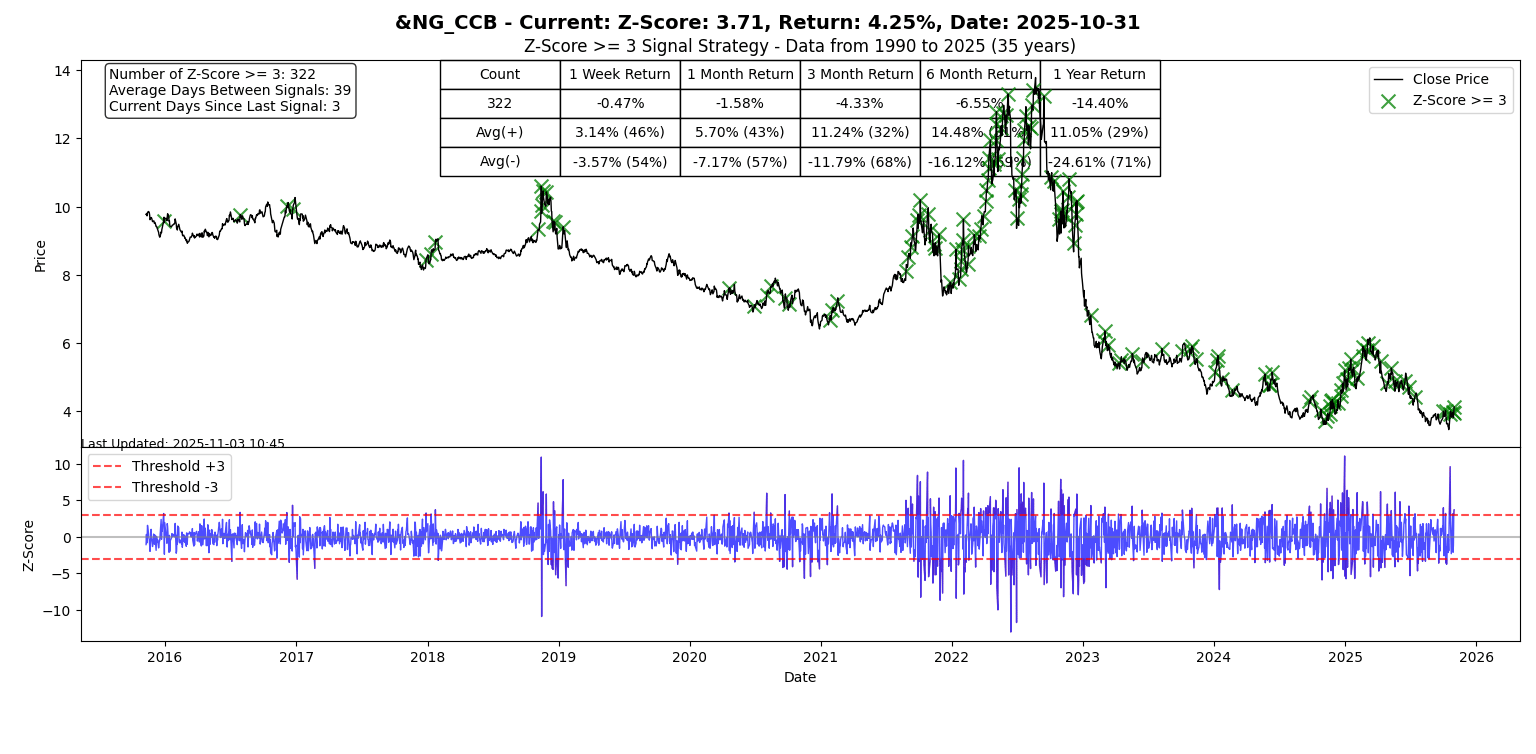
I honestly don’t know how you can trade natural gas these days. A three- sigma event is almost a daily occurrence. Yes, the obvious answer is to trade smaller, but an instrument that volatile is just difficult to handle. I should mention that I use an expanding lookback window for my Z score calculation, which means that I keep adding history to the calculation so that it is able to distinguish abnormal from normal.
If someone forwarded you this email, you can subscribe for free.
Please forward it to friends if you think they will enjoy it. Thank you.
S2N Performance Review



S2N Chart Gallery
S2N News Today

